|
The Great Recession is over, right?
In a recent hearing about school complexity funding (an additional boost of funds to schools with more disadvantaged kids) at the Indiana Statehouse, State Representative Tim Brown was quick to assert that Indiana is doing better financially. We are not as poor as we were. Maybe he's right according to the metric he uses. However, when we look at free and reduced lunch rates (FRL), we see a different picture.
Background on Free and Reduced Lunch Rates
FRL is part of the Richard B. Russell National School Lunch Act, which began in 1946 under Harry Truman. Most states--32—use FRL rates to measure poverty in schools. The FRL income rates are federally determined by multiplying the current year’s federal income poverty guidelines by 1.30 (free meals) and 1.85 (reduced price meals). For example, the 2019 federal income poverty level for a family of four is a maximum $25,750 annually. Multiply that amount by 1.30, and the maximum annual income for free lunch is $33,475. Multiply it by 1.85, and the maximum annual income for reduced lunch is $47,638. In addition, the following qualify for free lunch: children who are in households that receive benefits from SNAP Supplemental Nutritional Assistance Program (SNAP) or Temporary Assistance for Needy Families (TANF), children who are in HeadStart, children who are in foster homes, and children who meet the definition of homeless, migrant, or runaway.
Complexity funding in Indiana was based only on FRL rates for a number of years. However, in 2015 lawmakers decided to shift to using the number of students who receive food stamps (SNAP), welfare (TANF), or are in foster care (keep in mind that education funding has not kept up with inflation in Indiana, so districts were, and still are, grabbing for fewer dollars). That narrowed the group of students, and funding since 2015 to help educate disadvantaged students has fallen by 30 percent. School administrators are concerned that the current method is undercounting high-need students. Granted, FRL is not a perfect indicator of poverty. This was mentioned by Daniel Thatcher from the National Conference of State Legislators in the hearing about complexity funding at Indiana’s Statehouse in October. The same meeting where Rep. Brown said “Indiana isn't as poor anymore.” While some critics may say that the data captures those up to 185% above federal poverty level, and that that's too high, it's important to note that families, especially those with children under 18, face economic stress even if they aren't earning below the federal poverty level. “The federal poverty level is not a very good measure of need. It’s too low,” said Elaine Waxman, a senior fellow studying food insecurity with the Urban Institute, a think tank that also presented at that hearing on complexity funding. Another problem with FRL is that it is self-reported. If a parent or guardian chooses not to report for whatever reason—pride, immigration status, inability to read the paperwork, too busy working too many jobs, etc.—then funding that should go to the student can be lost. On the flip side, it’s possible for a household to not be honest about its income in order to receive free or reduced price meals. Another problem is that since 2010, kids who qualify for SNAP, TANF, or are in foster care automatically qualify for FRL. This slightly bumps up FRL numbers from 2010 onwards, capturing kids that may have slipped through the cracks in prior years due to the self-reporting flaw. Problems aside, FRL is a metric used by IDOE. It indicates relative poverty. It is used to analyze data from attendance, and graduation rates to homelessness and test scores. It is present on Compass going all the way back to 2005. There is value in this metric, even with its flaws.
Free and Reduced Lunch Rates from 2005-06 to 2019-20
How are families with kids in school faring in 2019–20 compared to similar families in 2005–06? In Monroe County and surrounding areas, families with school-aged children appear to have gotten poorer—in some districts, dramatically so. FRL rates have climbed. Collectively, these families aren't in the same financial position as their 2005–06 counterparts. 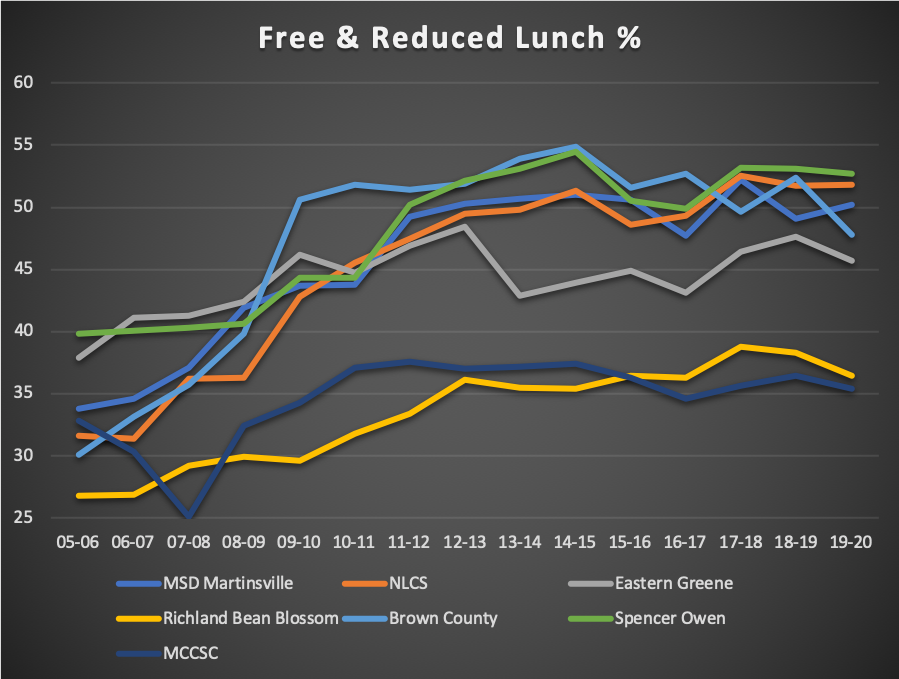
* In 2007–2008 MCCSC's Reduced Lunch Rate is lacking from state data, which is why it drastically goes down and then back up the following year.
The FRL rates for the years 2005–06 and 2018–19 are as follows. Note the percentage change between the first and second numbers, which is presented in the last column. Of this group of neighboring districts, Monroe County Community School Corporation had the lowest percentage increase in FRL, at 7.9%, whereas North Lawrence saw an increase of 63.9%.
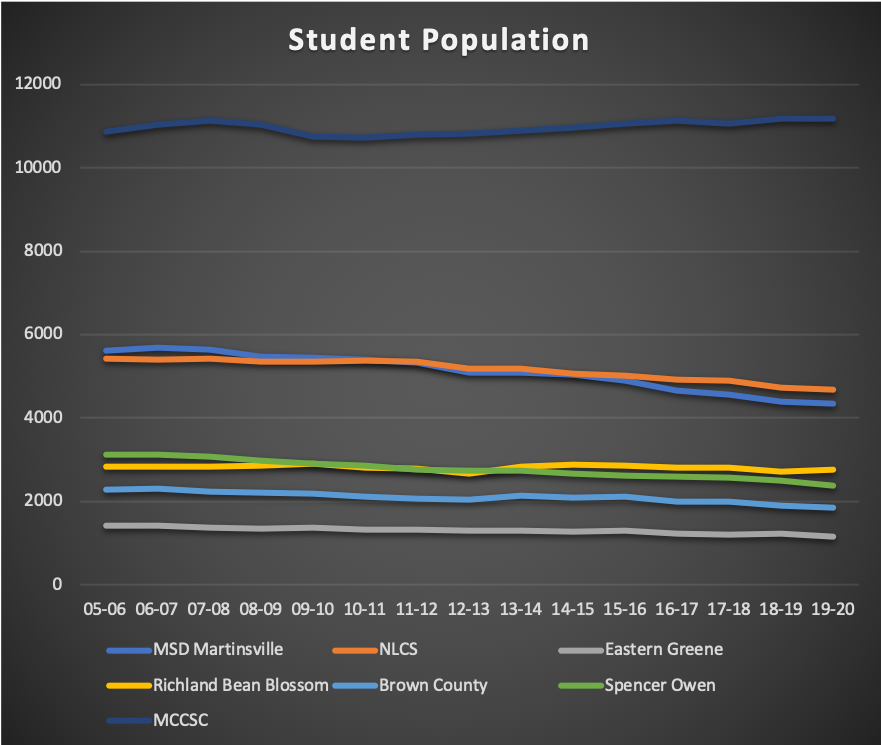
Not Only Is Poverty Higher, Rural Populations Are Shrinking
Some rural communities are losing residents. Industries may have shut down. People may have moved elsewhere for work. People may be having fewer children, or may be sending their children elsewhere for schooling. Since school funding is based mainly on per-student tuition support, fewer kids means less money for schools.
The Problem Is Greater than the Schools
The hollowing out of rural populations, and the intensification of poverty in rural areas, is not something that a school district or city can fix alone. It requires state-level decisions like reforming the tax system, addressing minimum wage, and truly investing in infrastructure, including in public education.
What You Can Do
When poverty goes up, so does the importance of public schools in children’s lives as stable places with caring adults. For example, many schools now serve supper in addition to breakfast and lunch to ensure children are fed. Your attention to the environment in your child’s school matters. Faced with a budget crunch, some school districts are consolidating and cutting programs like arts and languages. Some may lack full-time nurses, librarians, and counselors. Consistently ask your child about what’s going on in school. Talk to your child’s teachers. Ask them if you can help in any way. Attend school board meetings. Call your legislator and meet with them to talk about the problems in your community. Get engaged. Vote for public education.
–Keri Miksza and Jenny Robinson
P.S. How Are the Schools in Tim Brown's District?
It occurred to us that maybe the schools in Tim Brown's district were actually faring better than the ones in Monroe County and surrounding areas, and maybe that would be why he sticks to his one metric and insists that Indiana is doing better. So, we looked it up. While only one school district in his area has FRL rates over 50%, both Western Boone and Sheridan Community Schools have seen their free lunch rates almost double since the 2005–06 school year. Representative Brown is choosing to keep company with facts that are different than the ones on the ground, in the schools and homes where the kids in his district spend their days. It may be that he doesn’t regard the free and reduced lunch rates as relevant. After all, back in 2015 he said, “Did Mary’s mother get arrested the night before? Did Johnny not come with shoes to school? Those to me are not core issues of education.”
* Lebanon CSC FRL number for 2005-06 is 2006-07 because the 2005-06 reported number is incomplete.
*All table and graph data presented in this post come from IDOE Compass.
|
Categories
All
Archives
March 2024
Friends
|

 RSS Feed
Proudly powered by Weebly