|
Free lunch rates are a proxy for family income levels. To qualify for free lunch, you need to make 130%, or lower, of what the federal government has set as the poverty level for a family of a given size. In 2018–19, that was about $33,000 for a family of four. A high free lunch rate means that a school serves mainly low-income families, many of whom are likely dealing with the stresses of poverty: food insecurity, unemployment, multiple low-paying jobs, irregular medical care, transient housing situations, and transportation challenges. A low free lunch rate, on the other hand, means that a school serves a more affluent population with more of its basic needs met.*
In the course of looking into how free lunch rates are related to ILEARN passing rates, we got valuable information about what income levels different types of Indiana schools—all publicly funded—are serving. Among public, charter, Catholic, Lutheran, and “independent” (other religious private) schools, there are clear trends, and clear aggregate differences, in student bodies when it comes to wealth, poverty, and the stretch between. 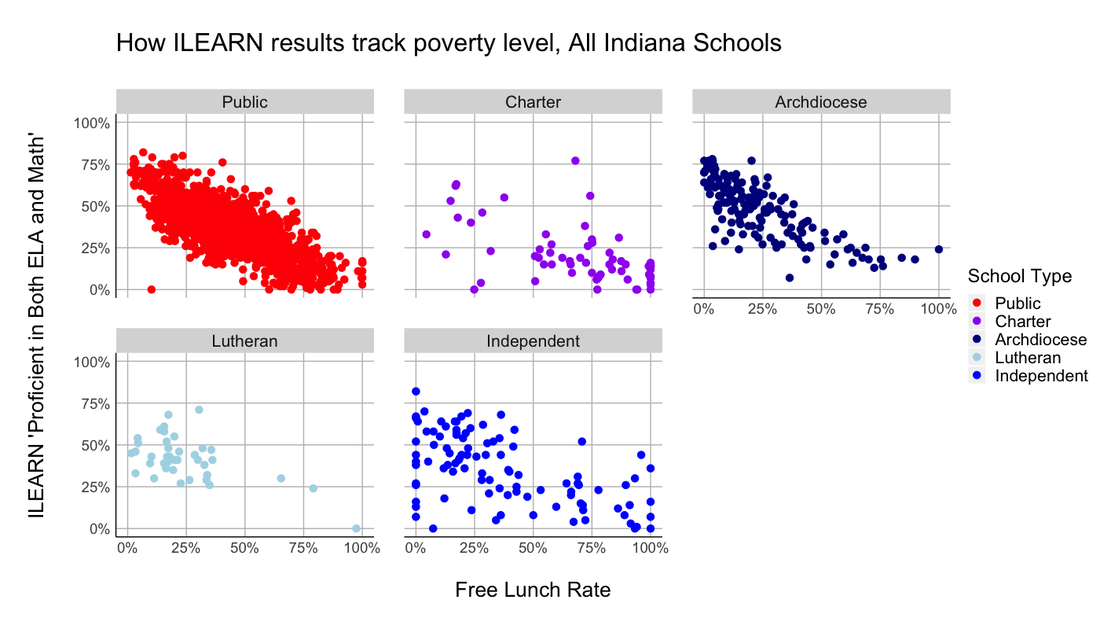
How do free lunch rates differ at the different types of schools? Here are some takeaways:
1) Public schools serve the most students and the broadest range of students. Some public schools have very low free lunch rates, some have very high ones, and many are in the broad middle: they are densest in the 25% to 75% free lunch range. There are many public schools in the 0–25% range, and slightly fewer in the 75–100% range. Because there are so many public schools, the dots representing schools form a large oblong shape, like a big diagonal fish, and you can clearly see the close connection of free lunch rate and ILEARN scores. 2) The bulk of charter schools serve higher-poverty populations, likely because many are in the urban cores of Indiana’s cities. Only eleven of the 59 charter schools pictured here serve a population in the first two quartiles of free lunch, the 0–50% range. The rest are pretty evenly distributed throughout the 50–100% range, but with a number clustered on the 100% mark. (There are about 100 charters in Indiana this year, but about forty do not have populations that were tested—probably because they are high schools only.) Keep in mind that the number of charter schools is different than the number of charter students. About a quarter of charter students attend poorly performing online (“virtual”) charter schools. That’s not visible in the ILEARN data because those online schools are mainly high schools, whose students did not take English and math ILEARN. 3) Lutheran schools are clustered in the lowest poverty (0–25%) quartile, with some in the 25–50% range and only three total schools in the 50–100% range. Lutheran schools are not evenly distributed. They are serving well-off students, relatively speaking. They appear to have lower average ILEARN performance than public schools with similar free lunch rates. 4) Catholic (Archdiocese) schools are densest in the lowest poverty (0–25%) quartile, with a fair number in the 25–50% quartile, fewer in the 50–75% quartile, and very few in the 75–100% free lunch quartile. Their scores are no higher on average than those of public schools with similar free lunch demographics. As public schools do, they show a strong connection between scores and free lunch rates. 5) Independent schools (mainly religious schools that are neither Catholic nor Lutheran) are all over the map both in terms of free lunch rate and scores. While the free lunch/ILEARN score connection is present, many have lower scores than the public school trend line would predict. Looking at these graphs, it’s impossible to argue that publicly funded schools that are not public are showing higher achievement (as measured by ILEARN) than public schools when you take into account the income levels of the populations they serve. That’s probably why some well-bankrolled entities advocating for “choice”—i.e., the diversion of public funds into private and privatized schools—have pretty much abandoned that line of argument. Others are still making it despite evidence to the contrary. What, then, is the Indiana supermajority's rationale for moving public money into schools that do not have the same transparency requirements, obligations to serve all students, and democratic local governance as public schools? In the case of the Catholic and Lutheran schools, money is leaving the public school system, further depleting inadequate funds, to go to private schools that disproportionately serve more affluent students. When state grades based on ILEARN are given to schools, they will reward the affluent and punish the poor, just as they did with ISTEP. This is not an occasional problem, a bug, but rather a feature that is baked into the school grading system. Teachers rallying at the Indiana Statehouse on November 19 will be demanding that legislators hold schools and educators harmless for low scores in this first year of ILEARN. But even if legislators and the State Board of Education respond as they should, it will not address the larger problem: that grading schools based on test scores consistently labels and harms schools and educators serving vulnerable populations. Do your state representative and senator approve of that? Do they vote to transfer taxpayer dollars away from public schools into other, less accountable types of schools? Have you asked them? Have you conveyed your concerns? When you talk to your local legislators, we encourage you to print out these graphs, which use data from the Indiana Department of Education. –Keri Miksza and Jenny Robinson *It’s important to note that free lunch rates don’t tell us about the extremes and are limited in their description of an area’s income. For instance, a school with a 20% free lunch population could potentially have a higher average income among its families than one that served 10% free lunch. |
Categories
All
Archives
March 2024
Friends
|

 RSS Feed
Proudly powered by Weebly