|
Indiana’s new standardized test, ILEARN, may be new and even “computer adaptive,” but it has at least one thing in common with its predecessor ISTEP+. Scores on ILEARN correspond to socioeconomic status. Put simply: The poorer the families served by your school, the poorer your school will perform on the test. Shocking, we know. Some news reports about the test talk just about the overall low scores. Others go skin deep by comparing the average scores of schools and districts. But scratch the surface, and you’ll find that this test—despite its price tag of $45 million—delivers more of the same. For example, take the 20 schools with the highest ILEARN averages, clustered in the upper left of the following graph. Minus two outliers (one of which had only 30 students take the test), the top-performing schools had 0 to 25% of students qualifying for free lunch, and in half of those schools, fewer than 5% qualified for free lunch. The free lunch rate is an indicator of the poverty level of the population served by a school; across Indiana, the average free lunch rate is 40%. Two of these top-scoring schools—both religious schools that received vouchers—had 0% of students qualify for free lunch. 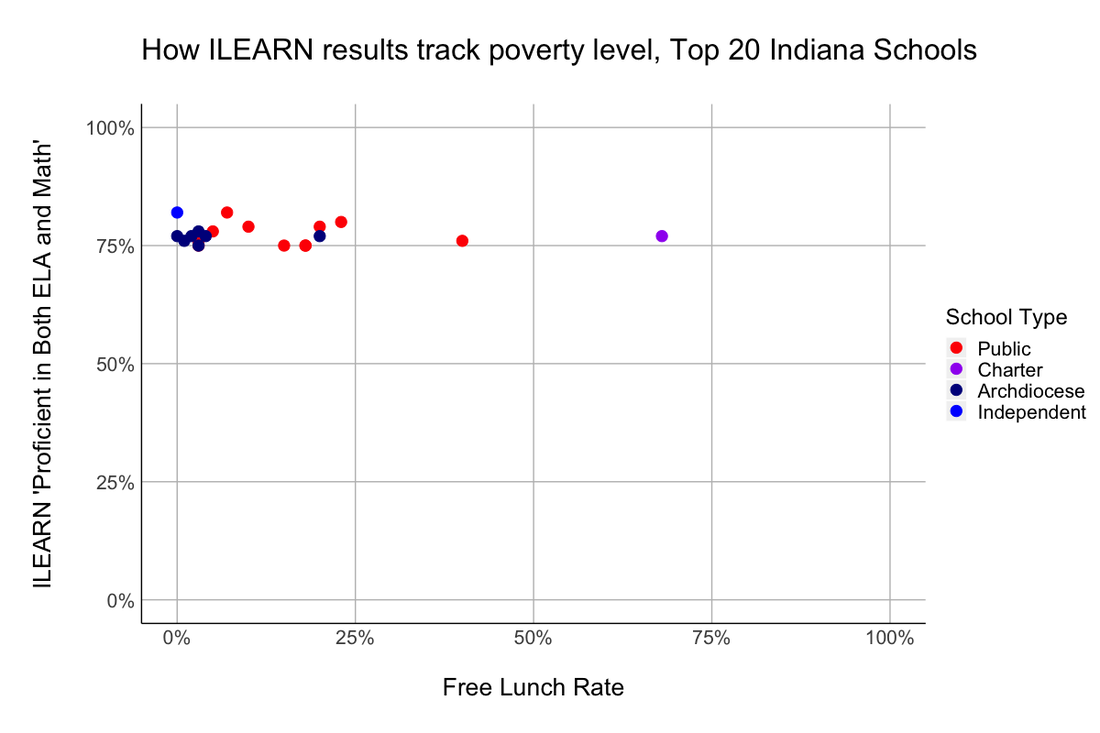 When you look at schools in Monroe County—public, charter, and private—you will see a textbook-worthy example of statistical correlation. 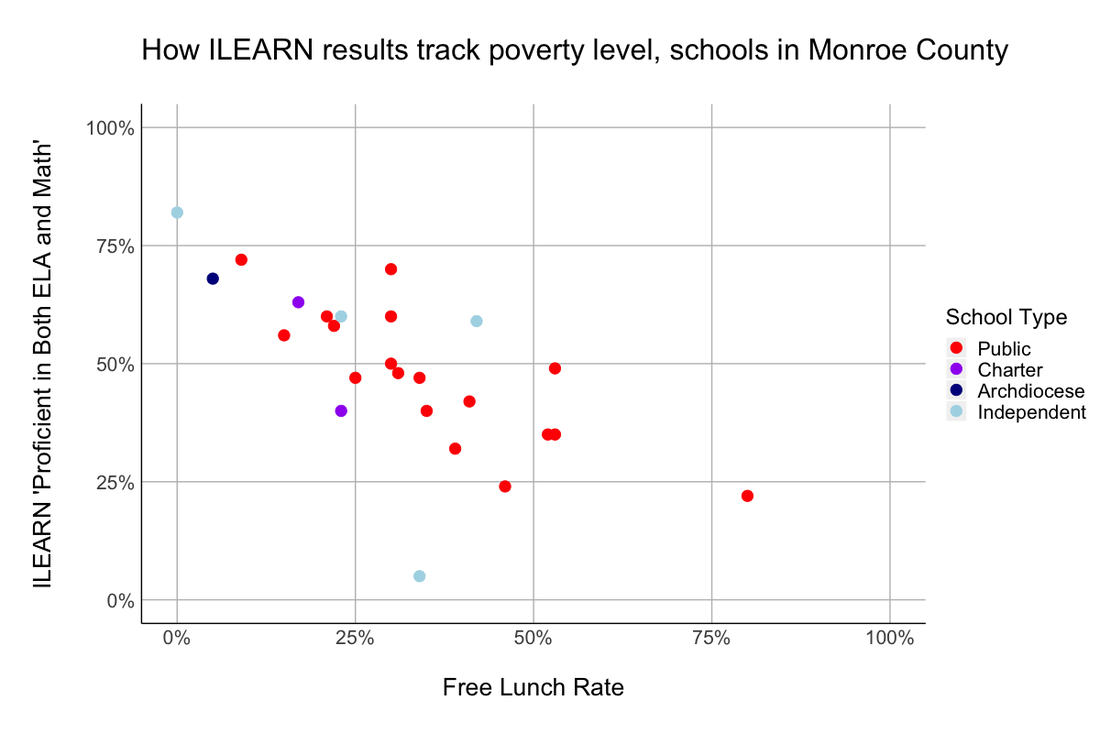 And to hint back at our voucher blog post, here are the ILEARN averages of schools in the Archdiocese of Evansville presented against those of the local public school district, Evansville-Vanderburgh. Look at this graph and ask yourself if this merited the headline, “EVSC below state ILEARN average while Warrick, Catholic schools above.” 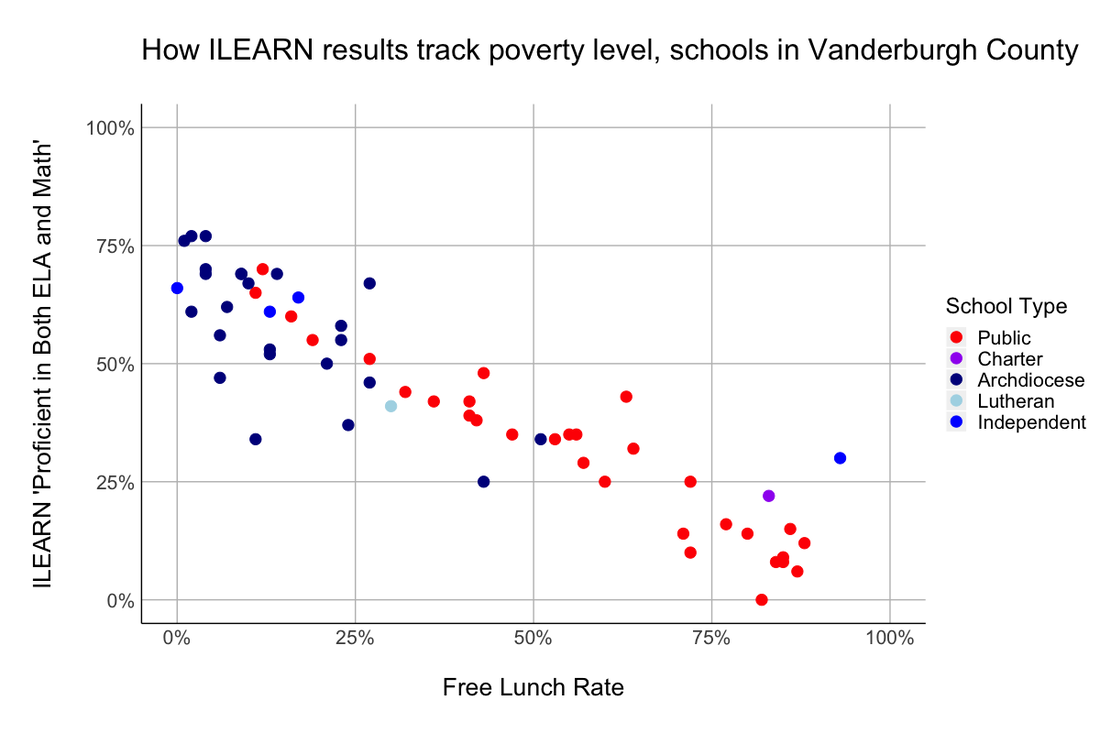 We’ve combined the ILEARN data with free lunch data for schools across Indiana here (the source for both is the IDOE; ILEARN was administered to grades 3-8 so only those schools are included). This is the resulting scatterplot: 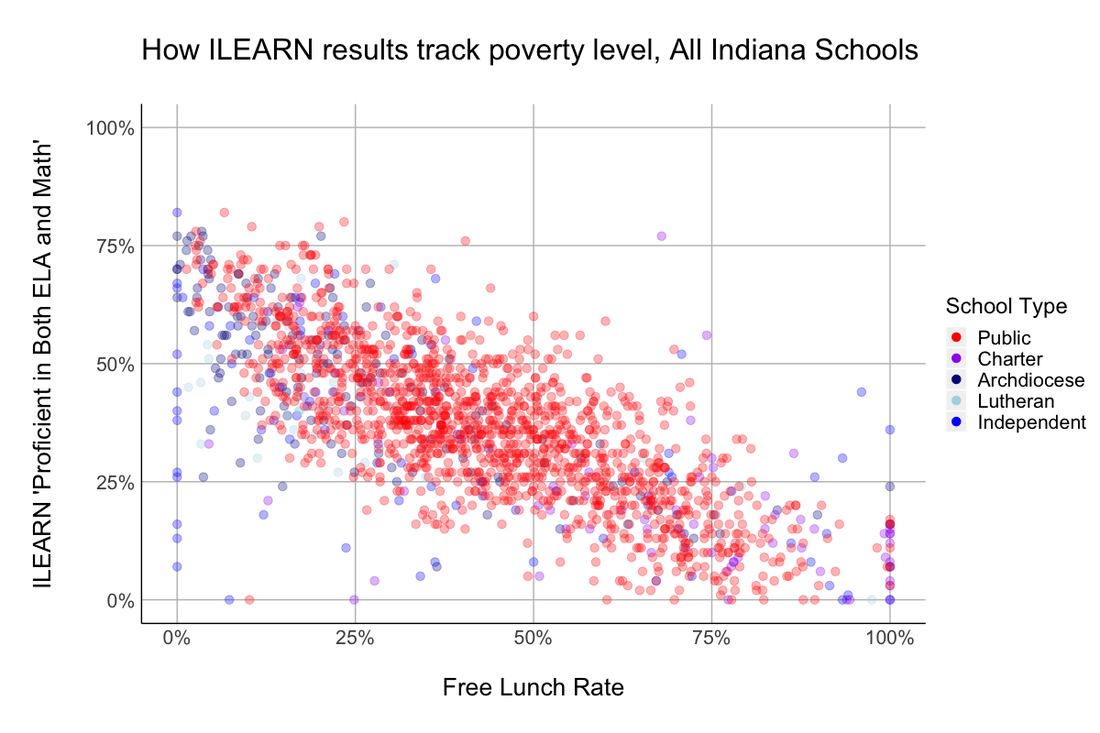 We invite you to explore this data and share what you learn with the editor and education reporter of your local paper—if you are lucky enough to have a local paper—and with your state senator and representative.
Maybe next year, instead of headlines like, “X schools score well, Y schools score badly,” we'll see headlines like “ILEARN scores reflect wealth and poverty—again.” (See, for instance, this coverage in Ohio in 2017.) Is the important question “How can we improve schools' ILEARN scores?” Or do we need an array of questions? Such as:
Now those might just lead to an actual accountability system. –Keri Miksza and Jenny Robinson P.S. For those who would like the statistical nitty gritty, Pete Miksza has explained the following to us: Monroe Pearson correlation coefficient r = -.70. There is a strong negative (e.g., inverse) relationship between free lunch qualification and ILEARN proficiency. Those schools that have the most free lunch students also have the lowest ILEARN proficiency rates, and vice versa. On average, schools experience a .70 percentage point drop in proficiency with each percentage point increase in free lunch qualification. Each 5% increase in free lunch qualifications is associated with an approximately 3.5 point decrease in proficiency. Each 10% increase in free lunch qualifications is associated with an approximately 7 point decrease in proficiency. Etc. Vanderburgh Pearson correlation coefficient r = -.91. There is an extremely strong negative (e.g., inverse) relationship between free lunch qualification and ILEARN proficiency. Those schools that have the most free lunch students also have the lowest ILEARN proficiency rates, and vice versa. On average, schools experience a .65 percentage point drop in proficiency with each percentage point increase in free lunch qualification. Each 5% increase in free lunch qualifications is associated with an approximately 3.25 point decrease in proficiency. Each 10% increase in free lunch qualifications is associated with an approximately 6.5 point decrease in proficiency. Etc. All The Pearson correlation coefficient r = -.74. There is a strong negative (e.g., inverse) relationship between free lunch qualification and ILEARN proficiency. Those schools that have the most free lunch students also have the lowest ILEARN proficiency rates, and vice versa. On average, schools experience a .56 percentage point drop in proficiency with each percentage point increase in free lunch qualification. Each 5% increase in free lunch qualifications is associated with an approximately 2.5 point decrease in proficiency. Each 10% increase in free lunch qualifications is associated with an approximately 5 point decrease in proficiency.
Phillip Harris
9/29/2019 01:10:47 pm
A great explanation for those who really want to know the truth of the matter of state test scores. Regarding ILEARN the state has required the school districts to administer a test that cannot be verified that it has any validity or reliability. When I requested the data I was told that it was not available. Then how come the state released the test and required its administration? Without this date the state cannot make a judgment about whether it is getting what it paid for in the 45 million contract!! Comments are closed.
|
Categories
All
Archives
March 2024
Friends
|

 RSS Feed
Proudly powered by Weebly